
Understand first, then act

Without the right level of scrutiny, it can be easy to misinterpret a metric (key measurement, KPI) and waste valuable time and resources debating and taking actions to “fix” things that may not be “broken.”
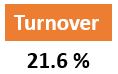
Let’s take an example to illustrate: Employee turnover. Let’s say I show you this number and tell you that this represents Employee turnover at a company:
I would imagine you would have some questions for me? Let’s go through some questions I expect you to ask me as we clarify what that number means. (Answers in blue from an HR representative at a fictitious company)
- How do you define turnover and how did you calculate that?
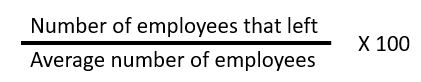
Answer: The company defined employee turnover as the number of employees who left the company. And they calculate that number this way:

If you think this number is high or low, hold your horses, we have a few more questions to ask before we can come to a conclusion.
- Over what time period was this number calculated?
Answer: It represents the employee turnover over one quarter.
An unusually high or low number can be an anomaly if it represents, for example, one day or one week out of a year. And that could be for many reasons including possible entry errors or calculation errors. If it is an average over an entire year, an unusually high number may indicate an alarming trend.
- What is this metric about?
Here you would like to understand the reason why they are tracking the metric and how they are using this metric for decision-making.
Answer: “We want to make sure that we retain employees and do not have too many people leaving thereby causing us to have to retrain people on a regular basis. We also want to avoid constantly having to hire and onboard people to replace those who left. We think it is disruptive to the business. We have set a limit of 7% as a reasonable employee turnover maximum.”
Knowing that this is about retention helps to understand the metric more. For example, you could now start to form an idea in your head about the employees that a company would like to retain. To ensure you lose no more than 7% of your employees through resignations, you would want to ensure that internal communication is going well, that employees feel appreciated and that there are development opportunities for them etc. (These would be all the efforts you could make to increase employee engagement and satisfaction). But it is also immediately obvious that 21.6% is much higher than 7%! So we need to ask more questions.
- What is the context of this metric?
With this question, you are trying to understand if there were any events or special circumstances that may have contributed to this metric being unusually high or low. It may also highlight how this metric compares to other periods – is it higher or lower than in the past?
Answer: “The metric is much higher than in previous quarters. During this quarter, we had to lay off some people due to losing a large customer. We also let some temporary workers go. And some people have chosen to take early retirement with the incentives that we offered around the reduction in workforce.”
Going back to how they calculated the 21.6% you may now wonder if they did the calculation correctly. If the metric is about making sure that they retain employees then it would be logical to ensure they do not include those who leave involuntarily – due to a lay-off for example. And there was also mention of temporary workers. Workforce planning often includes having a pool of temporary/agency workers who can more easily be let go of in the event of an organizational downturn. From that perspective, it would also not be useful to include those workers in an employee retention metric. It is time to question the number of people who left the company – the 108. Having obtained more information about the 108 employees, we see that this number represents various groups including retirees, agency workers, redundancies, and resignations.

In this case, the only unplanned people that the company “lost” = 32
In that case, the metric calculation would result in 6.4% which is below the 7% limit that was set as a goal. It is important that the definition of the metric is clear about which groups of people who left should be included or excluded in the calculation.
In summary, we can make some suggestions for this HR team:
- Clear name and definition. Perhaps the metric should be redefined and possibly renamed if their intention is to capture how many employees (not temporary workers) resign from the company and to keep that % below 7%.
- Share definition with stakeholders. Just looking at 21.6% employee turnover can be alarming so it would also be very important that the metric is well understood by the team and its key stakeholders outside of the team.
- Accuracy. To avoid any possible calculation errors, it could help if somebody audits the metrics before the dashboard is finalized and distributed. The credibility of the HR team can be impacted if an executive team regularly sees errors or inconsistencies on the HR dashboard.
Keeping track of key metrics to monitor the success of specific processes or initiatives is important. That way you would be able to easily identify if a project or an objective is in danger of failing to achieve desired outcomes at the end of a year. Early identification also enables you to take the appropriate actions to correct an alarming trend. The key is to ensure that metrics on a dashboard are accurate and easy to interpret by those who view it. Be intentional and critical when you choose the metrics to track and when you define them to stakeholders.
When reviewing metrics, ensure that you truly understand what they represent before drawing premature conclusions. Planning actions to rectify premature conclusions could be a waste of your valuable time and resources when they are based on erroneous assumptions.
