
How many leaders are we developing for future leadership roles? Where should you be spending your employee development efforts? What is the best way to spend your training budget to contribute to the company’s ability to produce desired results? Being able to answer these questions, is the reason you would want to be able to do a talent audit.
You may benefit from doing a talent audit – review your team and your leaders to get to a thorough understanding of the needs of each individual and the capabilities of your entire team/organization.

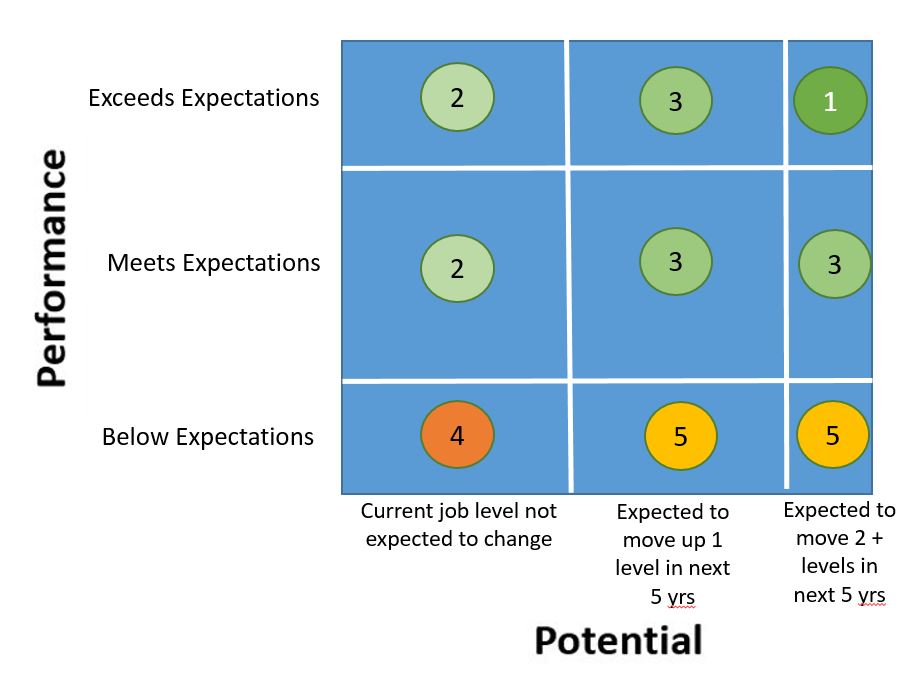
The vertical axis on this graphic is where you rate the performance of the employee and the horizontal scale is where you rate his or her potential to reach higher levels of leadership in the company if you develop him or her.
The green star example would be a leader who is performing exceptionally high and who also still has the potential to move up more levels within the company – maybe 2 or 3 levels more in the next few years.
The red star would represent a leader or employee who is not performing according to expectations at all and who has not shown any signs of being capable of or motivated to move up any levels in the company.
When you are used to looking at your leaders and teams in this way, you may not need to use a formal checklist, but you should be able to do this on the back of a napkin. Until you can do that the resource I am sharing below and which you can download, may be useful.
An easy checklist for employees and leaders is shown below – note how well they are performing in their current roles and then compare that to how much potential do they still have to move up a level or two in the company in the short to medium term.
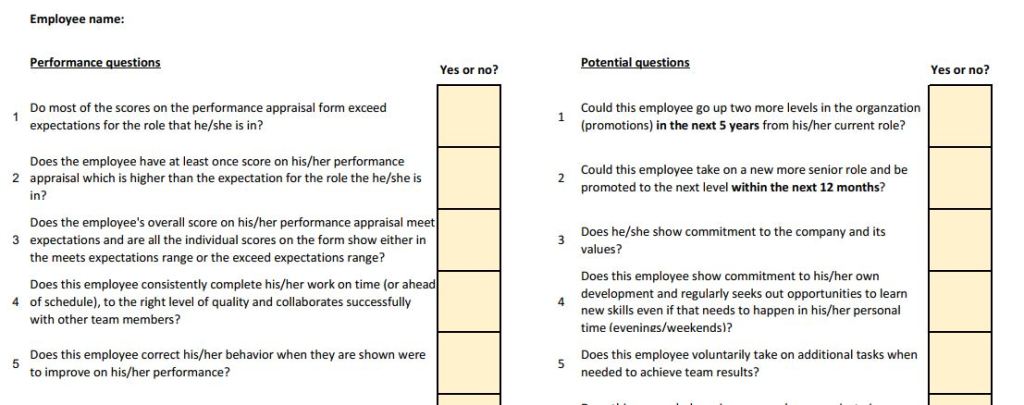
Once you have the number of YES answers to the questions in the downloadable link above, you can plot where each leader or employee would be on chart like the one shown below. The maximum value would be 12 on the potential axis and 11 on the performance axis. Your scores will likely be somewhere between zero and those maximum numbers. The scale for both axis is 0 in the bottom left corner and the the top of Performance would be the maximum and the right side of the Potential axis is the maximum.
Using the checklist helps you determine where your current employees and leaders would fit on the model shown above. All you need to do is answer yes or no to the questions shown. When you get to the bottom count the number of times you answered yes and calculate the % yes score (total yes answers divided by number of questions).
Alternatively you can use the next figure (see below) to plot the employees. Review their latest performance review outcomes against the vertical scale: Exceeds Expectations, Meets Expectations and Below Expectations. Looking at the employee’s motivation, mindset and capabilities – does he or she have the potential to move up some levels in the company? Plot that against the horizontal axis.
To ensure a good perspective of the employee pool that you are reviewing, ask various executives/senior managers who have regular contact with the employees to complete the list of questions in the resource. Combine all the answers to arrive at the final plot on the graphic for the employees/ leaders. Always perform a sanity check before you complete the final plot – employees must have the motivation and interest to advance in their own careers and have great interpersonal relationship skills before you can plot them towards the middle and right side of the horizontal scale.
Once you have the employees plotted as stars or markers on the diagram you can move towards planning next steps.
Interpreting the numbers in the chart shown above:
- These employees are able to grow to the top of the organization. Accelerate their development and make sure they have stretch-goal assignments.
- These employees are good performers who need to be recognized and you should keep them engaged. Retention is the word, especially if they possess key skills that are hard to find in the market.
- These employees need training, coaching and a structured approach to improve on their skills and competencies. Since they have the motivation, ambition and ability to move to higher roles in the company, the gap between future role requirements and current performance assessments should be driving the development actions needed.
- This group needs to be addressed fast. Or you can coach/motivate this employee to improve performance or you need to let them go. They are taking management energy away from growth and are not contributing to the company’s success. (If their below expectations performance is related to health issues – manage according to the local laws and agreements with unions etc.)
- The performance of these employees has to improve. There are several reasons why someone could be plotted in this group. a) some executives/managers see potential here, but the employees’ own motivation or ambition may not align with that – move the employee into the correct group – towards the left; b) personal or interpersonal issues may be at work here – try to resolve; c) employee does not understand what is required from a performance perspective – ensure clear goals and expectations are set and train/coach and review regularly to ensure that performance does improve.
This process is not static and you should review your plots at least once a year. It is possible for employees to move into other areas of the graphic after they get the promotion they worked towards or their motivation and ambition at work may change.
This annual review is an exercise that should include the executive team or management team for that location, because it is important that the senior team understands the talent and leadership potential that is available at that location. It is also important that multiple views are incorporated and discussed during the review sessions. It all starts with doing the first talent audit though and this tool will hopefully help you do that.
