


Most of us have had a situation where we are really not sure which way to go – which choice is best for us in a given moment? Some people ask all their friends and family for advice and then go with the most popular idea that came up. Others do a lot of research and still find themselves unable to make that final decision – option A, B, or C?
I learned this way of making decisions from a manager some years back. He called it a chicken-chart. I really do not know why, but the method has really helped me get clarity about decisions that were hard to make because none of the options were obviously better than another option from my perspective.
Simple steps to help you make decisions
Step 1
- What is the decision you have to make? Define it clearly. [In the example below the decision would be “Which company does Jack want to work for?”]
- Then write down the options you are considering. [In the example here: Jack is considering only Company A and Company B – you can put in any names that may be right for your decision]

Step 2
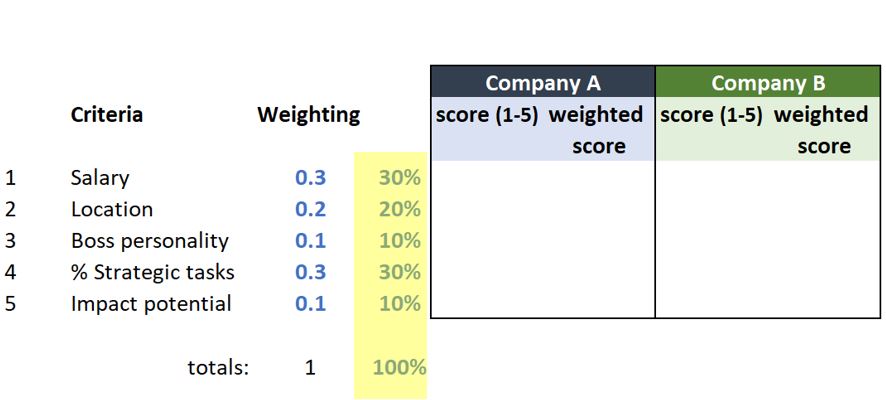
- Write down a list of the 5 to 7 most important things you want the solution to have. [In the example below Jack cares about a good salary, a good location for the office, the personality of his boss, the % of strategic tasks that he would be able to work on and the Potential impact that his work could have on team success]
- (see the example being used – a person called Jack is trying to decide whether he wants to work for company A or company B)

Step 3
Decide how much you like each of the criteria you wrote down. If you like it more, put a higher percentage on it (either in a 50% format or a 0.5 format). In the example below, you can see Jack decided that a good salary counts at least 30% towards his decision to work for company A or B.
Step 4
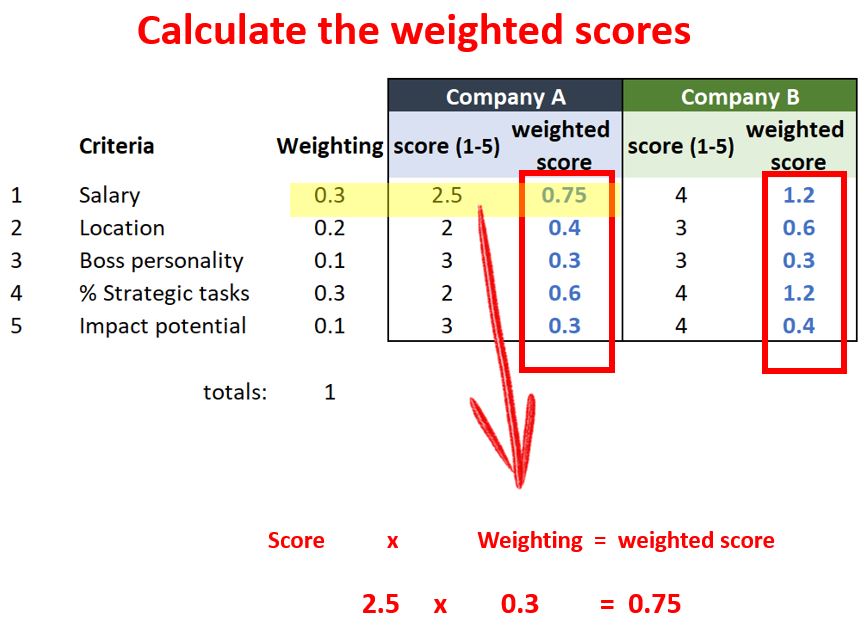
Start recording how much you like all of those aspects for company A. Then do the same for company B. Give each aspect a score between 1 and 5, where 1 is a really bad score and 5 is an excellent score for that company and for that aspect that is important to you.

Step 5
Let’s calculate the weighted score for each line item. It is really simple. It is simply: the weighting x score = weighted score.
Step 6
Now it is time to add up the totals. Get the total for the scores alone and then get the totals for the weighted scores.

Conclusion
If you look at the result from this example you can see that the difference between the total score for Company A (12.5) and the total score for Company B (18) in simple likes or scores is relatively small and if you used those scores to make the decision, you may have doubt about the choice ahead of you. The difference between your score for Company A and Company B is 44%.

If you look at the difference between the total weighted scores for Company A (2.35) and Company B (3.7), you see that the difference is much bigger because it now also includes how much Jack liked each of the criteria that he included in this exercise. In this case, the difference is 57%, which is bigger than the previous difference of 44% (for using only scores alone).
The final decision now seems more logical – to choose for company B because the difference between the two options is bigger – 57%. When you include the level of how much you liked one aspect of your criteria over another one – the difference (in this example) increased and it became much easier to know what to choose!
